Reports
The NoSpamProxy reports give you an overview of your email traffic history and how the volume of spam has changed over the months, as well as information on the email addresses and domains that received the most spam.

Reports
The reporting in NoSpamProxy Cloud now offers a quick overview of inbound and outbound email traffic as well as the top spam recipients.
TIP: You can hover over a date in all views to see exact details.
Dashboard
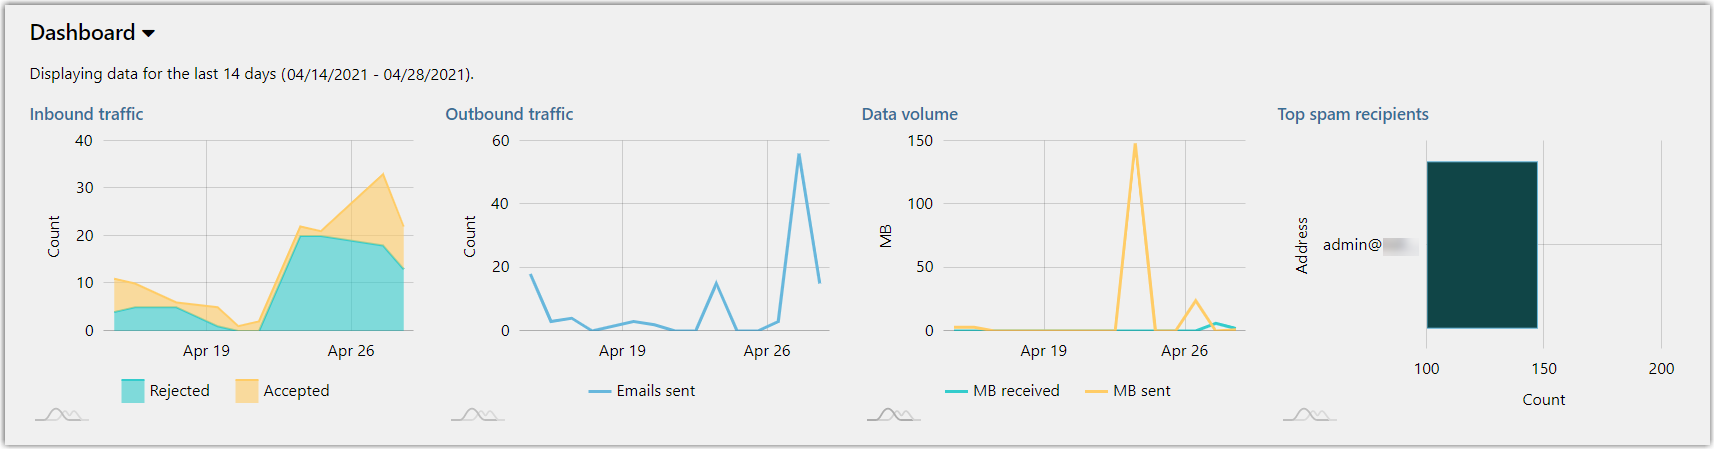
The dashboard shows you four quick overviews of
- inbound emails
- outbound emails
- the data volume (MB) and
- the top spam recipients.
Email traffic
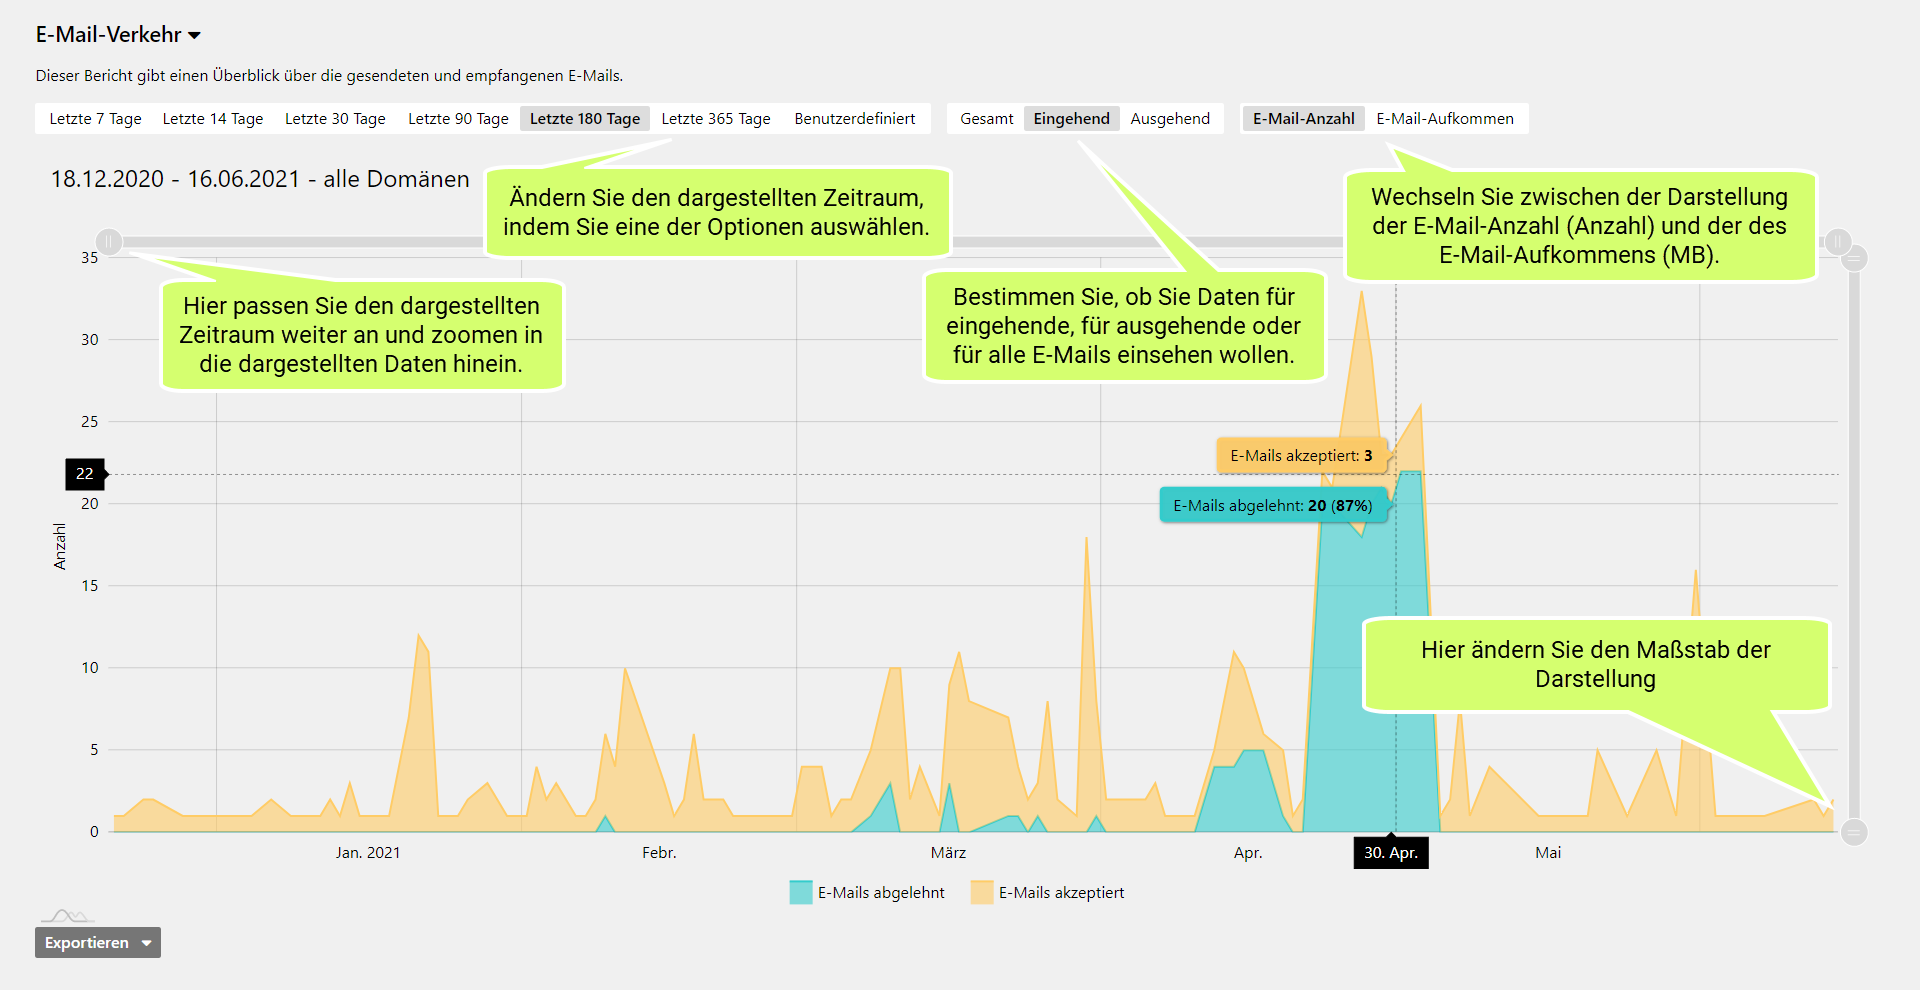
The detailed views on email traffic provide you with detailed overviews on the selected period and direction of the email flow. Adapt the individual charts to your needs by, for example, changing the time period displayed or displaying only data for incoming emails.
Top spam recipients
This view shows you the recipients who have received the most spam in the selected period.
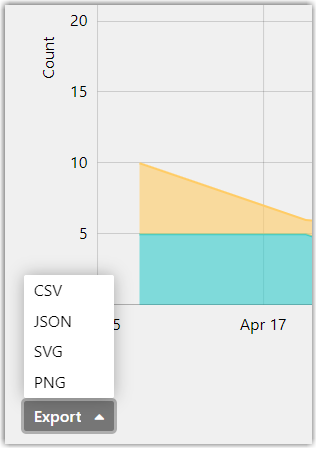
Exporting charts
You can also export charts as files in CSV, JSON, SVG or PNG formats.
- In the desired chart, open the drop-down menu in the lower left corner.
- Select the format in which you want to export the chart.
De-Mail
With the De-Mail report you can generate an individual connection overview for sent De-Mails as an Excel report.
Proceed as follows:
- Select whether you want to create an overview for the entire organization or for a specific domain.
- If necessary, restrict the time period for the overview.
- Click on Export as Excel file.
- In the following dialog, select where you want to save the Excel file.
- Click Save.