How to query the Windows Performance Counter using PRTG
The following performance counters are available on the server with the NoSpamProxy Gateway Role and can be integrated into PRTG.
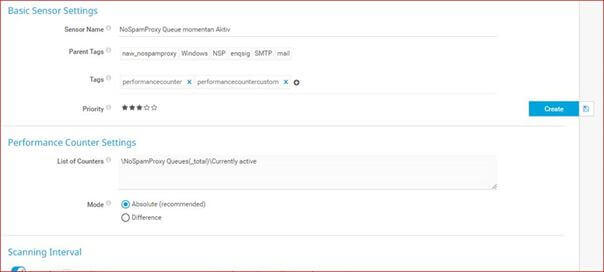
\NoSpamProxy Queues(_total)\Currently active
\NoSpamProxy Queues(_total)\Delay notifications sent
\NoSpamProxy Queues(_total)\Network failures
\NoSpamProxy Queues(_total)\Non delivery reports sent
\NoSpamProxy Queues(_total)\Pending mails
\NoSpamProxy Queues(_total)\Relay notifications sent
- In PRTG select the device (Gateway Role Server).
- Add a PerfCounter Custom Sensor using the right mouse button.
- Restrict the search for the sensor to be created using Custom Sensors/Performance Counters.
- The sensor name can be freely assigned
- Under List of Counters, enter one of the above (copy and paste).
NOTE: The interval is inherited from the host by default, but it can also be defined (see below).
- Click Create.